37
Dr. Kevin Bracker; Dr. Fang Lin; and jpursley

Question 1
In Finance terms, risk refers to the possibility of earning less than expected on a particular investment over a given time period. For instance, if I make an investment an anticipate earning a 5% rate of return over the next year, I am exposed to risk if there is any chance that I earn less than that 5%. The two factors that determine the degree of risk are (A) the extent to which I can earn less than expected and (B) the likelihood that I will earn less than expected. For instance, if my expected return is 5% and the worst possible outcome is that I earn 4%, there is not a lot of risk involved. On the other hand, if there is a chance that I will lose 60%, my risk is much higher. Also, if I will make 5% 99.5% of the time and lose 50% only 0.5% of the time, my risk is also not very great because the chance of a bad outcome is very small. A high risk investment means that there is both a significant chance of earning less than expected and the amount less that I can earn is relatively large.
Question 2
This is a false comment. You can avoid losing money and still earn less than expected. Very small rates of return over long periods of time are still “bad” outcomes and the chance of that happening means you are exposed to risk even if you can’t lose money.
Question 3
While both activities use risk in an attempt to earn a profit, there are several important differences. First, the risk-return profile is different. Most forms of gambling have a negative expected return (the “house edge”). Even games where you might argue that some people have a positive expected return (sports betting, poker, etc.), the average individual will lose money due to the fixed cost of paying the gambling institution offering the wager. On the other hand, investing typically offers a positive rate of return. While stocks and bonds have both had periods of negative returns, the long-run rate of return on both is significantly positive.
Another difference is that investing provides capital to a variety of businesses. Without stock and bond markets, there would be far fewer jobs and product innovation as the stock and bond markets provide the capital for businesses to operate. Gambling on the other hand tends to transfer wealth instead of create it.
Note that the above discussion does not imply that gambling is wrong and investing is right. Instead, the point is to illustrate that the combination of positive expected returns to investors and providing capital to businesses makes investing a net positive to society while gambling tends to transfer wealth from gamblers to gambling institutions and is thus neutral in creating wealth.
Question 4
Correlation measures the extent to which two variables (returns) move together. If two securities have a high positive correlation (say somewhere between 0.5 and 0.99) that means that they have a strong tendency to move in the same direction. When one security increases in value, it is likely that the other will as well. When one decreases in value, it is likely that the other will as well. However, since the correlation is less than 1.0, the will not ALWAYS move in the same direction. Two securities with high positive correlations could be any two securities in the same industry. Industry pressures will lead the securities to move in a similar direction most of the time. However, firm specific factors will keep the correlation less than 1.0.
If two securities have a low positive correlation (0.01 to 0.49) that means that they have a weak tendency to move in the same direction. While they move in the same direction (up or down) more frequently than not, it is not uncommon for one to be up while the other is down. Two securities with low positive correlations could be any two companies without a specific connection (for instance, Amazon and Exxon). Both will be exposed to the same general economic factors (leading to a positive correlation), but the different industry and firm specific issues will keep the correlations low. In general, most stocks should have low positive correlations.
If two securities have a negative correlation, that means that they tend to move in opposite directions (the closer to -1.0, the stronger the inverse relationship). Due to general economic factors, few stocks will have negative correlations (at least as an expectation). One possible example might be oil producers and trucking firms. Since an increase in oil prices will improve the value of assets and profits for the oil firms and lower profits for trucking firms, we might see negative correlations. However, the ability of trucking firms to pass along higher prices and periods with low oil price volatility will mean that even here we may not see that significant of an inverse relationship.
Question 5
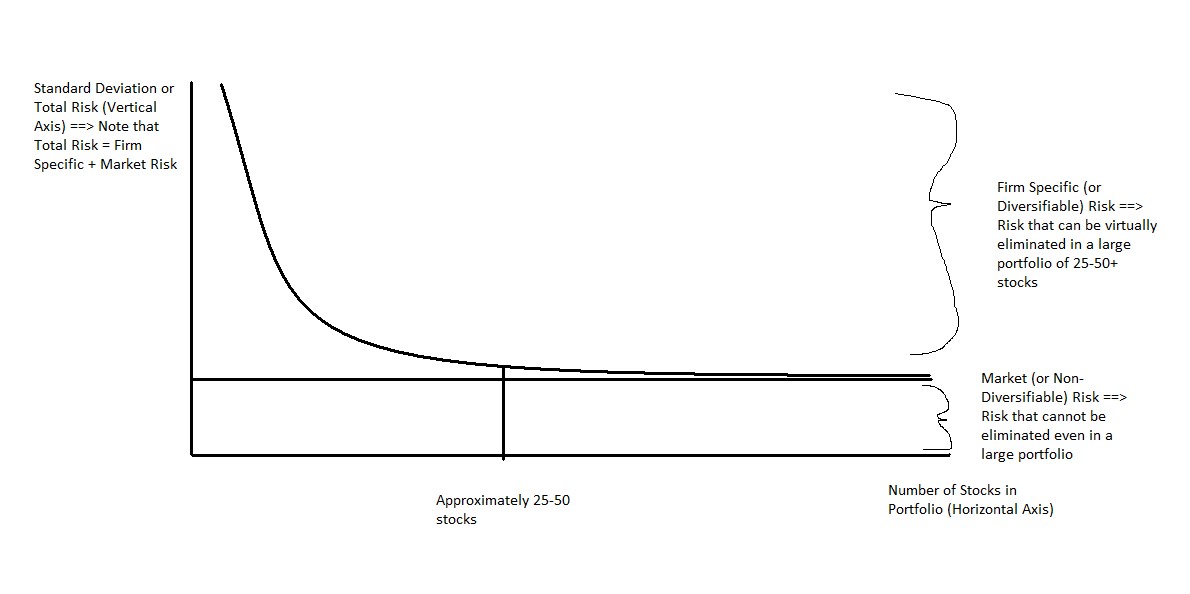
Diversifiable (Firm Specific) risk is risk that can be virtually eliminated by holding a large portfolio of securities from a variety of industries. An example of a diversifiable risk would be the success or failure of a new product introduction by a firm. For instance, if Ford’s new auto line is poorly received and results in a bad year or two for the automaker, this will not impact the other stocks in my portfolio. Thus, as long as I own several other stocks in a variety of industries, my overall portfolio will not be hurt much by Ford’s problems.
Non-Diversifiable (Market or General Economic) risk is risk that can NOT be eliminated by holding a large portfolio of securities from a variety of industries. An example of a non-diversifiable risk would be a sudden surge in inflation. This would result in most stocks declining and I couldn’t eliminate this risk regardless of how many stocks were in my portfolio.
The diagram below indicates how we can diversify away most of our firm specific risk in a large portfolio (25-50+ stocks), but market risk remains.
Question 6
Standard Deviation measures total risk. Total risk is both firm specific and market risk combined. Standard deviation is important when I am considering putting all of my money into a single security or a non-diversified portfolio. The reason total risk needs to be considered in these situations is that we have not diversified away our firm-specific risk so that it is still relevant. On the other hand, if we are adding a security to a well- diversified portfolio, the standard deviation of that stock is not important. Because we own a well-diversified portfolio, the firm specific risk of the stock will be unimportant and we only need to focus on the market risk.
Question 7
Beta is a measure of market risk. While every firm has market risk and it can not be eliminated in a portfolio, some firms are more sensitive to market (general economic) factors than others. Therefore, the market risk of some stocks will be higher than the market risk of others. A portfolio of stocks with high market risk can still be diversified (so that firm specific issues are not relevant) and yet increase at a rate faster than the market or decrease at a rate faster than the market. When we are adding a security to a well-diversified portfolio, we no longer need to be concerned about firm-specific risk, but only about market risk and how it will affect our portfolio’s sensitivity to general economic/market forces. When we are considering investing all of our money into a single stock, beta is not relevant because we need to focus on the total risk instead of just the market risk factors.
Question 8
When we are comparing two well-diversified portfolios, either beta or standard deviation will work. That is because since both portfolios have essentially zero firm-specific risk, the total risk of the portfolio will effectively equal the market risk of the portfolio. Whichever portfolio has more market risk (higher beta) will also have more total risk (higher standard deviation).
The table below illustrates when we should focus on standard deviation (σ) as a measure of risk and when we should focus on beta (β) as a the appropriate measure of risk.
| Evaluating the risk of a single security in isolation or comparing two poorly diversified portfolios | Evaluating the risk of a security to add to a well-diversified portfolio | Comparing the risk level of two well-diversified portfolios | |
| σ | X | X | |
| β | X | X |
Question 9
The stock should increase by 12.5% ⇒ (1.25×10%). While in reality it will likely increase by either more or less than 12.5%, my best guess today would be for an increase of 12.5%. If it increased by more than 12.5%, it would be because firm specific factors turned out positive and if it increased by less than 12.5% (or dropped), it would be because firm specific factor turned out to be negative. The 12.5% is based on the firm’s sensitivity to market factors. If I thought the stock market was going to decline by 5%, I would expect my stock to decrease in value by 6.25% ⇒ (1.25×-5%). For a stock with a beta of 0.6, it should increase by 6% if the market climbs by 10% and fall by 3% if the market declines by 5%.
Question 10
True. High beta stocks imply higher than average risk. Higher than average risk implies higher than average expected returns. We can also see this by looking at the security market line. If we have a beta of more than one, the required return will be greater than the expected return on the market. Note that this relationship is based on expected returns and not actual returns. The nature of risk is that sometimes we will lose money and with high risk we may lose a lot. While our expected returns are greater than the average return on the market, our realized returns may be higher or lower. Over long periods of time with well diversified portfolios, we should earn higher than average returns if beta is a good measurement of risk.
Question 11
False. Expected return does not mean realized return. While ON AVERAGE, we would make more money from stock B over the course of the next year, we don’t get to repeat next year 10,000 times to reach our average. Instead, we only get one shot. Its possible that stock B will earn quite a bit less than its expected return and stock A will earn quite a bit more.
Question 12
In equilibrium, expected return should equal required return. If this is not true, the price will adjust until we move back into equilibrium. In this example, the expected return moves to 18%, while the required return stays at 13%. This means investors anticipate earning an 18% return on average while a 13% return is enough to compensate them for the risk they are taking. Since they can earn 5% more than they need to compensate them for the risk, they will buy the stock. As a large number of investors start buying the stock, the price will increase. Since the expected cash flows associated with the stock are not changing, the higher price means that there will be a lower expected return (see a more detailed explanation of this below). The price will continue to go up until the expected return falls to 13%. At that point, there is no reason for people to keep buying the stock and pushing up the price because they are only earning the required return. At this new price, the stock is worth buying, but at any higher price it would not be. Thus, we are back in equilibrium.
This process should happen instantaneously if markets are efficient. People will see the discrepancy between expected return and required return and start buying immediately. With everyone wanting to buy at the same time, the price will respond immediately.
A lot of people struggle with the idea that an increasing price leads to a lower expected return. At first glance, it seems counter-intuitive as if we see the stock price going up we might think that it is a “good” stock and expect it to continue to go up more in the future. However, if you think of a stock as the present value of all expected cash flows AND we increase the price while holding cash flows constant, you can see that you are paying more for the same set of cash flows. Since you are paying more for the same set of cash flows, you should expect to get a lower rate of return on your investment.
Problem 1
Exp Ret A = 0.20(-30%) + 0.40(15%) + 0.40(30%) = -6% + 6% + 12% = 12%
Exp Ret B = 0.30(-5%) + 0.40(10%) + 0.30(20%) = -1.5% + 4% + 6% = 8.5%
[latex]St.Dev. A=\sqrt{0.20(-30\%-12\%)^2+0.40(15\%-12\%)^2+0.40(30\%-12\%)^2}$[/latex]
[latex]St.Dev. A=\sqrt{352.8 + 3.6 + 129.6}[/latex]
[latex]St.Dev. A=22.05\%[/latex]
[latex]St. Dev. B=\sqrt{0.30(-5\% - 8.5\%)^2 + 0.40(10\% - 8.5\%)^2 + 0.30(20\% - 8.5\%)^2}[/latex]
[latex]St. Dev. B=\sqrt{54.68 + 0.90 + 39.68}[/latex]
[latex]St. Dev. B=9.76\%[/latex]
If you are going to put all of your money into one stock, you could choose either one. People that are more risk-averse will choose stock B while people that are less risk-averse will choose stock A. Note that both choices are consistent with risk aversion because the stock with the higher risk (stock A) also has a higher expected return.
Problem 2
Part 2a
Exp Ret C = 0.30(-10%) + 0.50(15%) + 0.20(40%) = -3% + 7.5% + 8% = 12.5%
Exp Ret D = 0.30(25%) + 0.50(10%) + 0.20(0%) = 7.5% + 5% + 0% = 12.5%
[latex]St.Dev. C=\sqrt{0.30(-10\%-12.5\%)^2+0.50(15\%-12.5\%)^2+0.20(40\%-12.5\%)^2}[/latex]
[latex]St.Dev. C=\sqrt{151.88 + 3.13 + 151.25}[/latex]
[latex]St.Dev. C=17.50\%[/latex]
[latex]St.Dev. D=\sqrt{0.30(25\%-12.5\%)^2+0.50(10\%-12.5\%)^2+0.20(0\%-12.5\%)^2}[/latex]
[latex]St.Dev. D=\sqrt{46.88 + 3.13 + 31.25}[/latex]
[latex]St.Dev. D=9.01\%[/latex]
Part 2b
Exp Ret Port = 0.5(12.5%) + 0.5(12.5%) = 12.5%
[latex]St.Dev. Port=\sqrt{(0.5)^2(17.5\%)^2+(0.5)^2(9.01\%)^2+2(0.5)(0.5)(17.5\%)(9.01\%)(-.75)}[/latex]
[latex]St.Dev. Port=\sqrt{76.56+20.30+-59.13}[/latex]
[latex]St.Dev. Port=6.14\%[/latex]
Part 2c
We should choose the portfolio because all three choices have the same expected return, but the portfolio has the lowest risk. All risk-averse investors will choose the portfolio over either stock individually in this situation.
Problem 3
Part 3a
Exp Ret Port = 0.65(20%) + 0.35(15%) = 18.25%
[latex]St.Dev. Port=\sqrt{(0.65)^2(25\%)^2+(0.35)^2(20\%)^2+2(0.65)(0.35)(25\%)(20\%)(1.0)}[/latex]
[latex]St.Dev. Port=\sqrt{264.06+49+227.5}[/latex]
[latex]St.Dev. Port=23.25\%[/latex]
Part 3b
Exp Ret Port = 0.65(20%) + 0.35(15%) = 18.25%
[latex]St.Dev. Port=\sqrt{(0.65)^2(25\%)^2+(0.35)^2(20\%)^2+2(0.65)(0.35)(25\%)(20\%)(0.5)}[/latex]
[latex]St.Dev. Port=\sqrt{264.06+49+113.75}[/latex]
[latex]St.Dev. Port=20.66\%[/latex]
Part 3c
Exp Ret Port = 0.65(20%) + 0.35(15%) = 18.25%
[latex]St.Dev. Port=\sqrt{(0.65)^2(25\%)^2+(0.35)^2(20\%)^2+2(0.65)(0.35)(25\%)(20\%)(0)}[/latex]
[latex]St.Dev. Port=\sqrt{264.06+49+0}[/latex]
[latex]St.Dev. Port=17.69\%[/latex]
Part 3d
Exp Ret Port = 0.65(20%) + 0.35(15%) = 18.25%
[latex]St.Dev. Port=\sqrt{(0.65)^2(25\%)^2+(0.35)^2(20\%)^2+2(0.65)(0.35)(25\%)(20\%)(-0.5)}[/latex]
[latex]St.Dev. Port=\sqrt{264.06+49+-113.75}[/latex]
[latex]St.Dev. Port=14.12\%[/latex]
Part 3e
Exp Ret Port = 0.65(20%) + 0.35(15%) = 18.25%
[latex]St.Dev. Port=\sqrt{(0.65)^2(25\%)^2+(0.35)^2(20\%)^2+2(0.65)(0.35)(25\%)(20\%)(-1.0)}[/latex]
[latex]St.Dev. Port=\sqrt{264.06+49+-227.5}[/latex]
[latex]St.Dev. Port=9.25\%[/latex]
Note that the expected return is not a function of the correlation while the standard deviation declines as the correlation drops. This is the “free lunch” of diversification – as long as we invest in securities with a correlation of less than one, we will lower our risk (st. deviation will be less than the weighted average of each stock’s st. deviation) without lowering our expected return (the exp. return will be the weighted average of each stock’s expected return).
Problem 4
Part 4a
[latex]Beta=\frac{(70)(0.40)}{20}=1.40[/latex]
Part 4b
Req. Return = 5% + 1.40(13% – 5%) = 5% + 11.2% = 16.2%
Part 4c
In equilibrium, expected return equals required return. Since the required return is 16.2%, the expected return should be 16.2% as well.
Problem 5
First, we know that the stock price should be found by using the following formula
P0 = D1/(k – g)
Now, we need to find each of the three inputs.
g is given at 4%.
D1 = D0(1 + g), so D1 = 1.50(1.04) = $1.56.
[latex]k=k_{rf}+\beta(\bar{k_{m}}-k_{rf})[/latex]
[latex]k=7\%+1.3(12\%-7\%)[/latex]
[latex]k=13.5\%[/latex]
Once we get all the inputs, we plug them back into the pricing model
P0 = 1.56/(.135 – .04) = $16.42.
The most we should pay for the stock today is $16.42.
